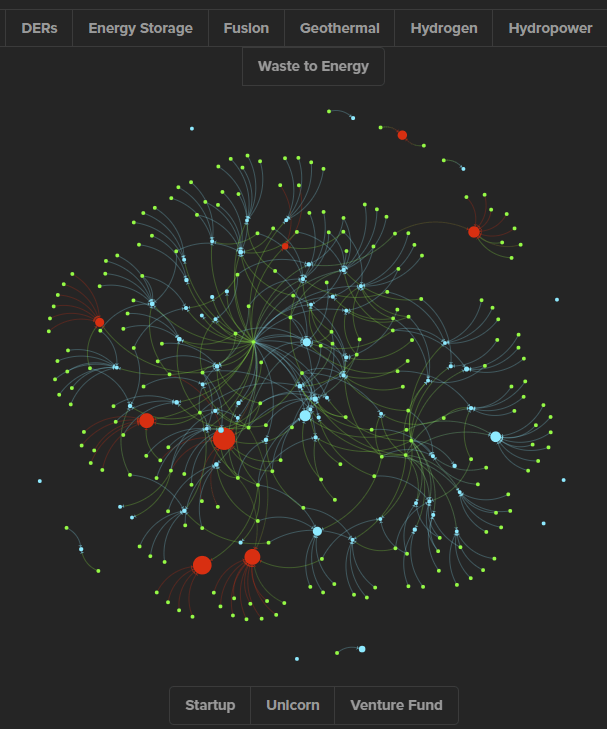
When I first began learning about energy, the complexity of the sector was overwhelming. It was challenging to keep track of the different subsectors, business models, and how they interacted with one another. There were ventures in everything from demand response contracts to fusion research. But the more time I spent reading and speaking with experts, the more I’ve seen patterns emerge. For example, I could see natural ebbs and flows in funding through the industry and geographic clusters in subsectors. I wanted a tool to help visualize these connections and uncover new ones. I spent the past month and a half compiling data from Crunchbase and Linkedin and building a visualization tool to help reveal some of these overarching patterns and spot potential gaps within the industry. I’m hoping this network map will serve as both a tool for entrepreneurs to identify sources of funding, investors to spot gaps, and learners to become excited about innovation in the energy sector. Please feel free to check it out!
Tool: https://kumu.io/vinaykonuru/energy-map
If you’d like to connect to learn more about the tool, please reach out to me at vkonuru@princeton.edu or DM me on Twitter. I’d love to hear from you! @vinaykonuru2001.
Please enjoy,
Vinay Konuru
